

mapping
ICC Indictments
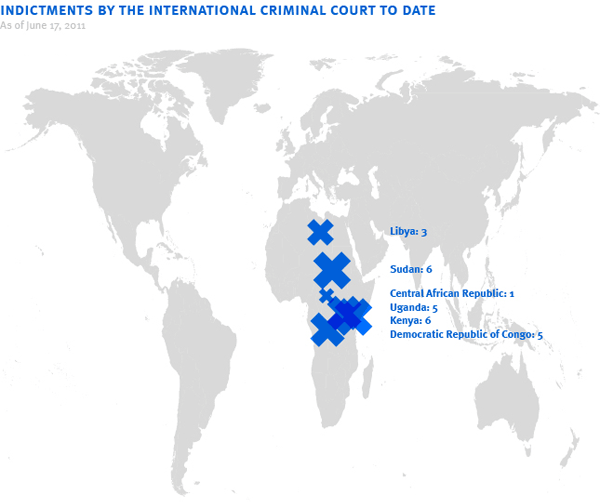
Since its founding in 2003, the International Criminal Court has issued 26 indictments. Not saying the charges aren’t warranted, but there seems to be a geographic pattern here. See also.
Google Earth and the Middle East
Ogle Earth runs down a brief list of ways Google Earth and the availability of satellite imagery in recent years have fueled class resentment and conflict in Bahrain, Iran, Iraq, Israel, Saudi Arabia, Sudan, Syria, Tunisia, and Yemen.
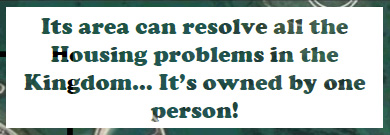
Leading the list are dramatic visualizations comparing the overcrowded living conditions of the Shiite majority in Bahrain with the palaces, estates, and private islands of the ruling families. After the country’s ISPs were ordered to block access to Google Earth’s imagery in 2006, this PDF of annotated screencaps illustrating the spatial inequities circulated widely by email.
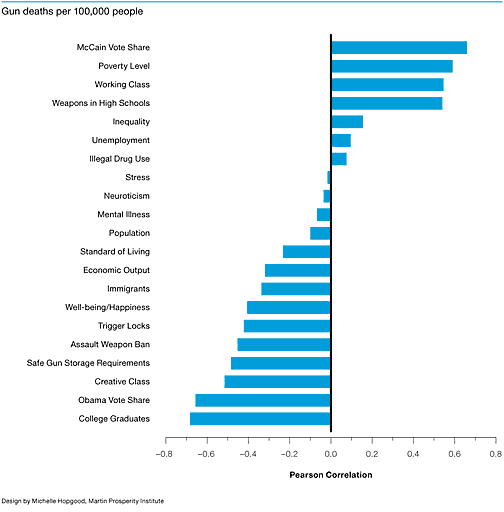
I’d love to see if a finer-grained city or census tract correlation bear out these findings, as well as other factors like, say, the scale of gun ownership.
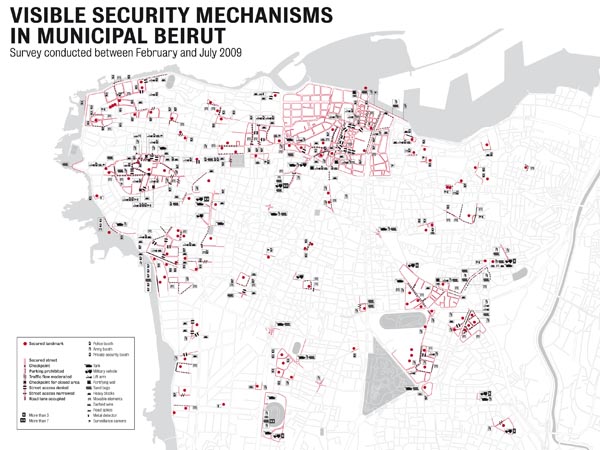
Beirut: Mapping Security
Beirut: Mapping Security is an ongoing research work and a newspaper publication edited by Mona Fawaz, Ahmad Gharbieh and Mona Harb, developed and assembled within the international network DIWAN.
“Armed conflict normalizes the presence of visible so-called security measures in the form of barricades, road blocks or army personnel in the everyday life of the city. This is perhaps one of the legacies of the Lebanese civil war (1975–1990), the Israeli occupation of parts of South Lebanon (since 1978), and the ongoing Arab Israeli conflict that have all marked Lebanon’s recent history. In Beirut security associated with these conflicts, whether in the form of protecting key political figures and/or preventing inter-communal violence, has been a latent aspect of the cityscape which heavily affects people’s everyday practices and movements. The recent development of a network of high-end shopping and entertainment facilities in Beirut has established a new layer of security, this time intended to protect the rich.
Our aim in this project was to initiate a public debate about the normalization of security as an element of urban governance and how this new narrative of threats and fear profoundly alters everyday practices.”
North and South
Just this week:
- Belgian Frontrunner Wants to Break up Nation: “Carving up Belgium has been a cherished dream for the far-right in Flanders, Belgium’s economically dominant north, and a nightmare scenario for poorer French-speaking [south.]”
- Sudan Must Prepare for Oil-Rich South’s Secession, Hassan Says
- South Korea Asks U.N. Council to Act Against North Korea
Also:
- Italy’s Northern League, currently in coalition with Silvio Berlusconi’s center-right party, has also advocated a split between the rich north and the impoverished south.
- North-South Divide Persists Decades After Vietnam War
- Kyrgyzstan: North-South Divide Is A Factor In Politics
Update 3/21/2010: the open source project Ushahidi has had some good press lately about its role in the Hatian and Chilean earthquake relief efforts, mapping the crisis and response with text-messages.
 A new pedestrian wayfinding system to help people walk around the Capital. See also:
Bristol Legible City, Southampton Legible City, Legible Dublin, and Connect Sheffield
A new pedestrian wayfinding system to help people walk around the Capital. See also:
Bristol Legible City, Southampton Legible City, Legible Dublin, and Connect SheffieldMapping Power
An article I wrote is out now in the Design Issues column of the May/June 2009
Communication Arts. It draws on the material I presented at Conflux in September 2008.
Mapping Power
Using design to get where we want to go
What is power? It’s an abstract dynamic, an engine behind the visible world. Power can be found in relationships, in the flow of resources or information, in signs, symbols and ideas or built into the environment. There’s no doubt that visual media has the power to influence an audience, but visual media can also be used to visualize power itself. Visualizing power is a way of interpreting and understanding it. And this understanding can become a basis for challenging it. Design can be used to describe and locate power, to pressure those who hold power, and ultimately to facilitate and generate power by bringing people together.