

June 2004
What is Asset Mapping?
I first heard of this in Japan a couple of years ago. A friend who ran a community development initiative in Boston’s Chinatown, was off to Gifu, the butt of all jokes and an industrial city struggling with the long recession and a loss of manufacturing jobs.
It took a while, but I finally had a chance to search around for a decent definition.
Community asset mapping sounds like a good way to begin analyzing and building political power within a community using design and graphics.
From a Michigan State University Best Practices Brief (468 Kb PDF):
“Community Asset Mapping is a capacity-focused way of redeveloping devastated communities. This positive approach is proposed as a substitute for the traditional deficits focus on a community’s needs and problems. Using problems to formulate human service interventions targets resources to service providers rather than residents, fragments efforts to provide solutions, places reliance on outside resources and outside experts, and leads to a maintenance and survival mentality rather than to community development.
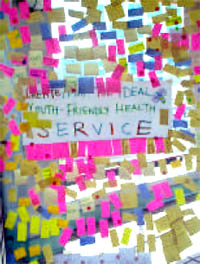 Instead, they propose the development of policies and activities based on an understanding, or ‘map,’ of the community’s resources — individual capacities and abilities, and organizational resources with the potential for promoting personal and community development. This ‘mapping’ is designed to promote connections or relationships between individuals, between individuals and organizations, and between organizations and organizations.
The asset-based approach does not remove the need for outside resources, but makes their use more effective.
The community assets approach
- starts with what is present in the community
- concentrates on the agenda-building and problem-solving capacity of the residents
- stresses local determination, investment, creativity, and control
In this context, spatial mapping may or may not be used. Within any given neighborhood or community, most assets as defined by Kretzmann and McKnight, [who developed the asset mapping approach to development,] do not have a spatial quality. Community Asset Mapping has very little to do with spatial mapping... and much more to do with a community survey and the mobilizing of individuals and organizations to make connections and build capacity. The information obtained through the survey process must be organized and accessed in an inventory format. It can be computerized as a data base inventory. Computerized mapping can be used, showing the location of assets on a geographic map, as well as the attributes attached to each asset.
The Community Asset Mapping process as outlined by Kretzmann and McKnight is intended to initiate a process that will fully mobilize a community to use its assets around a vision and a plan to solve its own problems. Their guidebook provides considerable detail about how this might be accomplished, with numerous examples of the types of connections that can be developed.“
Some forms of mapping include:
Mapping Public Capital
Such as
- social gatherings that enable people to learn about what is happening in the community
- organized spaces for interaction where people can learn about, discuss, and act on community challenges
- catalytic organizations that spur discussion on community challenges and marshall a community’s resource to move ahead;
- safe havens for decision makers to meet for unofficial candid discussions.
From this the community, can fill in gaps and identify action points and obstacles to overcome.
Cultural Mapping
Documenting cultural resources in the community — examining long-term customs, behaviors, and activities that have meaning to individuals and to the community. Information for cultural mapping is gathered by face-to-face interviews. Communities can use cultural mapping as a tool for self-awareness to promote understanding of the diversity within a community and to protect and conserve traditions, customs, and resources.
Community Relationship Mapping
Ecomapping was initially developed as an effective way for a therapist to identify relationships within a family. The mapping of inter-organizational linkages is a form of ecomapping designed to show the relationships that one organization has with other organizations within the community. Relationships with other organizations may relate to funding, referrals, access to resources, joint service planning, collaborative projects with contributed staff or funds, etc. Ecomapping may be undertaken to clarify the place of an organization in the community spectrum, to identify gaps in linkages, to indicate the multiple relationships between organizations, etc.
From the Northwest Regional Educational Laboratory, regarding the Mapping Community Assets Workbook:
“‘From a community development perspective, it helps to think of our communities in terms of their wealth—in people, things, services, and resources that they possess,’ says author Dr. Diane Dorfman. ‘To build from what you have requires asking different kinds of questions to learn different kinds of things about where you live.’
Learning how to ask what communities have to offer begins a process of building and developing. It brings knowledge, skills, and capacities out into the open, where they can work together to everyone’s benefit. As the web of assets grows, so does the potential for the community.
An asset map is an inventory of the strengths and gifts of the people who make up a community. Asset mapping reveals the assets of the entire community and highlights the interconnections among them, which in turn reveals how to access those assets.
The workbook’s engaging, lively style invites active participation on practically every page. Through a series of questions and exercises, readers first learn to uncover their personal assets, both tangible and intangible, material and nonmaterial. Then they expand to take stock of their community, listing all of its special features. Readers also learn how to design a questionnaire to uncover the hidden assets in their community, those from people or places that are not familiar.
‘Connections to people can also become connections to resource-filled institutions. Likewise, a connection to an organization or institution may actually conceal a personal relationship,’ notes Dorfman.
Here’s an annotated resource list on community asset mapping, and a page on asset mapping with youth.
Still there’s something curious about that Michigan State University’s ‘Capable Communities’ center. Why are they offering this particular public service? Is that university campus, like so many in the U.S., surrounded by pockets of poverty? With this image in mind, it occurs to me that Community Asset Mapping is rather “inward” focused. This is the point, I know, but it does not interrogate or confront external actors or institutions, economic or public policies that also give shape to the community. This is, perhaps, a different map. Building a stronger community, however, builds a solid foundation for challenging the status quo.
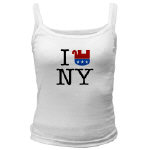
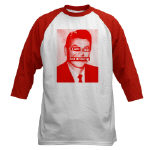
Fashion Statement

OK, OK, OK.
So, every time I show someone a graphic idea for a flyer or something they inevitably say, “You know, that would make a great T-shirt.”
Alright, then. I’ve created a few at CafePress. You can order them online at http://cafeshops.com/nornc
For sale: T-shirts, tank tops, posters, postcards, and stickers to welcome the Republicans in style.
Only three designs so far, but let me know what you think and I might make more.
Note, all prices shown are CafePress’s base prices. I’m not making any money here. I just want to get the word out.
---
And by the way, if you want to design some T-shirts yourself, CafePress makes it fairly easy. Basically, you upload a high resolution graphic through your Web browser to their Web site, select the product, and order it online. Voila! They handle the payment processing, printing, shipping, and customer service. You can put your design onto T-shirts, hoodies, lunch boxes, frisbees, postcards, and more. (See for instance, this lovely turntable mousepad I made.) Setting up a basic store online is free.
Preaching to the Converted
One often hears the criticism that political graphics are just “preaching to the converted.” After all, no one’s mind is changed by a poster. Why waste limited time and energy on mutual admiration? A self-reinforcing love-in doesn’t move the masses.
This criticism assumes that such graphics are actually intending to change the mind of the viewer. In turn, this is based on a narrow conception of how advertising works: one sells an idea, brand, or product to a passive and otherwise uninterested consumer.
Whatever the intention, the function of posters is often not to change people’s minds outright, but to push them in a certain direction. Posters make ideas publicly visible and provide alternative explanations, interpretations, narratives, and myths, or reinforce existing ones. Whether or not they directly convince, posters can provoke skepticism. And, without putting forth a nuanced argument, posters can provide notice of an event or opportunity.
Within politically marginalized communities, posters are a way for the community to assert its voice publicly, to put forward its own images and narratives, promote collective action, and ultimately seize political power and push for social change. When no dissent is visible in the corporate media, posters and graphics are one alternative venue. Showing cracks in the ‘consensus’ may convince others to speak out.
While many in the street are ephemeral and quickly replaced or washed away, posters also have historical value. They are often collected and preserved by a variety of individuals and institutions. As Carol Wells, of the Center for the Study of Political Graphics, points out, when history is written by the victors, posters provide a tangible record of social movements otherwise confined to the margins or entirely left out of the ‘acceptable’ narrative. Such grahpics are a visible voice from the past that future generations can learn from and build upon.
But if graphics don’t change people’s minds, how does one reach those ‘moderates,’ ‘undecideds,’ and ‘swing states’? drapetomaniac once proposed that changing minds is often an indirect result of propaganda. No one I know listens to right-wing talk radio, yet somehow its arguments seep into the “mainstream,” occasionally tilting “conventional wisdom,” and ultimately trickling into casual conversation. I imagine that hearing an idea one agrees or learning additional facts, broadcast with conviction from a source you trust may do something to bolster one’s own confidence. And in conversations with others, this must surely come across.
While those 92% of people polled who said political ads had not swayed them to change their prospective votes, how would a poll measure the impact of the ads on the people who agreed with the messages? i.e. of those people on others?
So why not preach to the converted? There’s certainly a value in bringing people together around an issue, rallying the base, and reinvigorating exhausted campaigners.
Envisioning Cities
Image manipulation software, like Adobe Photoshop, can be a powerful tool to involve communities in the process of urban development.
From the Local Government Commission:
Computer Simulation as a Public Participation Tool
 “Most of us have a hard time envisioning what two-dimensional plans or a development proposal will look like when built. Computer simulation translates such plans and descriptions into pictures that help us see what a proposed development will actually look like. This allows residents and policymakers alike to make more informed planning decisions.
Simulation exercises help settle complex planning issues and guide design and planning activities. As a mechanism to improve public communication concerning local planning and development issues, computer simulation can be used to
- Help develop design guidelines
- Evaluate controversial proposals
- Analyze urban design qualities before formal discussion begins on an actual proposal
- Develop choices about the appearance of a project
 Before the advent of personal computers, architects and urban designers were only able to show their clients what a proposed project would look like through artist’s renderings and/or by constructing elaborate three-dimensional models. Such models and renderings are expensive and time consuming to produce.
Today, advances in computer technology, such as computer aided drawing and design (CADD), global information systems (GIS), and advanced two and three-dimensional graphics software, have made it possible for design professionals to present their projects to clients or the public through computer simulation. Computers make it possible to produce highly accurate simulations faster and less expensively than do traditional methods. Furthermore, once computer simulations are produced, they can be easily adapted to design changes. An artist’s rendering, in contrast, may have to be completely redrawn.
Computer simulation begins with a scanned photograph of a building or area within a community. Using computer software, elements of the image are added, taken out, or otherwise reorganized into a new image representative of a proposed development design strategy. The result is a series of before and after images...
This technique allows all stakeholders to see the differences in proposed design styles and development patterns and allows decision-makers to evaluate the potential impacts of proposed developments.”
From the company Urban Advantage:
“Working with architects, planning staff, and citizen groups, we create visions of pedestrian-friendly, socially-interactive communities by transforming photographs with photo-editing software. In addition to the illustration skills necessary to make seamless montages, we also incorporate into the images an understanding of urban planning, architecture, arboriculture, and transportation. This results in informed collaboration with clients.”
Some of their before and after photo simulations are truly stunning — though after a while, the solutions do start to look a lot alike.
The LGC page lists serveral other specialist firms that provide illustration services, but with the increasing power of home computers and the increasing popularity of digital cameras and image manipulation software, I imagine that community residents themselves might also be able to render their own visions.
Was that March?


On a couple of occasions I’ve noted my admiriation for the design used by United for Peace and Justice to publicize anti-war events in New York City. The simple flag and globe motif on a bright blue ground and its bold sans-serif type are eye-catching, clear, and instantly recognizable.
However, the consistency and repetition of such a strong image in the same context (via stickers and flyers) over nearly three years may be diminishing its impact. As one UPfJ organizer notes:
“We love the blue flag standard, but have heard feedback that the design has been the same for too long... folks think it’s for an old demo.”
Dear Mr. Reagan,

See also Graphics for the Gipper, an online exhibition from the Center for the Study of Political Graphics showing more than 45 posters criticizing Ronald Reagan over two decades.
Spanish Castle Magic
 I just saw the latest Harry Potter installment and more than anything else, was struck by Hogwarts castle.
Having just spent the last weeks running around Spain looking at castles and fortresses, cathedrals and mosques, it was all so clear: who gets to build such things but people and institutions with enormous wealth and power? Wealth and power acquired and maintained primarily through inheritance and military force.
Much has been written about nostalgia for royalty, the restoration of noble blood, and inherited class privilege in Star Wars, The Lord of the Rings, and Harry Potter.
But I haven’t seen anything about this now painfully obvious clue — the politics of the architecture in fantasy literature.
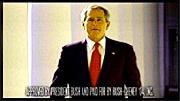
Voters Unmoved by Presidential Campaign Ads
From AdAge, May 24, 2004, “Consumers Largely Unmoved by Presidential Campaign Ads”:
“More than half the consumers queried in a new Advertising Age poll conducted by Lightspeed International Research said the blitz of presidential campaign ads had not influenced them and in total, 92% said the ads had not swayed them to change their prospective votes....
 The online poll, conducted among 1,653 respondents nationally who have seen ads for both candidates, also breaks out eight battleground states. In those states, which are carrying the bulk of the presidential hopefuls’ advertising, both candidates’ ads are viewed as even less persuasive....
The majority, 60%, of national respondents said Mr. Bush’s ads aren’t focusing on issues they care about, and even more, 69%, said Mr. Kerry’s ads don’t address issues they care about....
To no one’s surprise, two out of three respondents — regardless of state or party — view political ads for the presidential race overall as too negative. And that could work against the candidates, as one-third of respondents said a candidate’s negative ads — rather than sway them to vote for that candidate — may actually influence them to avoid voting for them.
Oddly, while ads from the Bush campaign have mostly attacked Mr. Kerry, who has been running mainly biographical spots, poll respondents saw the challenger’s ads as more negative than Mr. Bush’s. A full 61% of those surveyed said Mr. Kerry’s ads were more negative in the national sample vs. 54% for Mr. Bush.
 The reason may be that Democratic groups such as Media Fund and MoveOn.org have been running anti-Bush attack ads and the comments about the negative Kerry ads apparently reflect those ads rather than those from the campaign itself. In fact, among the general population, respondents were equally split on whether they could distinguish ads between candidates or public interest groups. (Respondents in Florida and Ohio were more likely to be able to distinguish the two.)
In some battleground states, however, the results ran counter to the national results. In Michigan and Minnesota, more people found Mr. Bush’s ads negative than they did Mr. Kerry’s.
Even though the election is a little over five months away, already 55% of respondents believe there is too much political advertising.
They are also largely unimpressed with the largesse. Half of respondents on a national basis said Mr. Bush’s ads don’t clearly state his position; Mr. Kerry fared worse, with 70% responding that his ads don’t clearly do so.”
From the data, it seems voters are craving more information and less rhetoric. And might MoveOn’s celebrated Bush in 30 Seconds ads be doing more harm than good? (Though, might Ad Industry professionals have something against ads produced by “amateurs”?) I wonder how these figures compare with past presidential elections.
Still even 8% of several million is several thousand voters who might tip a another close election. But then we also that know what users say is not always what users do.
The article does not elaborate on the methodology or link to an example of the online poll. I’m wonder how the poll addresses ads that put forward a substantive critque of the candidates — in other words “negative” ads that do address issues.
But really, “voters” as “consumers”? Wow.